You will receive a call within 24 business hours (8 AM to 9 PM, except Sundays)

Canara Robeco Consumer Trends Fund
Invest NowThematic - Consumption & Finance Theme - An open ended equity scheme following the consumption and financial theme.
<div class="table-responsive"> <table class="table table-bordered k-table" style="margin-bottom:0;"> <thead> <tr> <th colspan="3"> <p class="font12" style="font-weight:400;"><strong>This product is suitable for investors who are seeking*</strong> </p> </th> </tr> </thead> <tbody> <tr> <td> <div> <ul class="TextMiddle"> <li> <p class="font12">Capital appreciation over long term</p> </li> <li> <p class="font12">Investing in equity and equity related securities of companies following the Consumption and Financial Theme </p> </li> </ul> </div> </td> <td> <h3 class="secTitle fixedside" style="text-align:center;">Risk-o-meter</h3> <img alt="" src="/Investor-assets/images/06-Very-High.jpg" /> </td> <td> <h3 class="secTitle fixedside" style="text-align:center;">Benchmark Risk-o-meter</h3> <img alt="" src="/Investor-assets/images/Very%20High%20Risk..png" /> </td> </tr> </tbody> </table> </div>
-
Risk
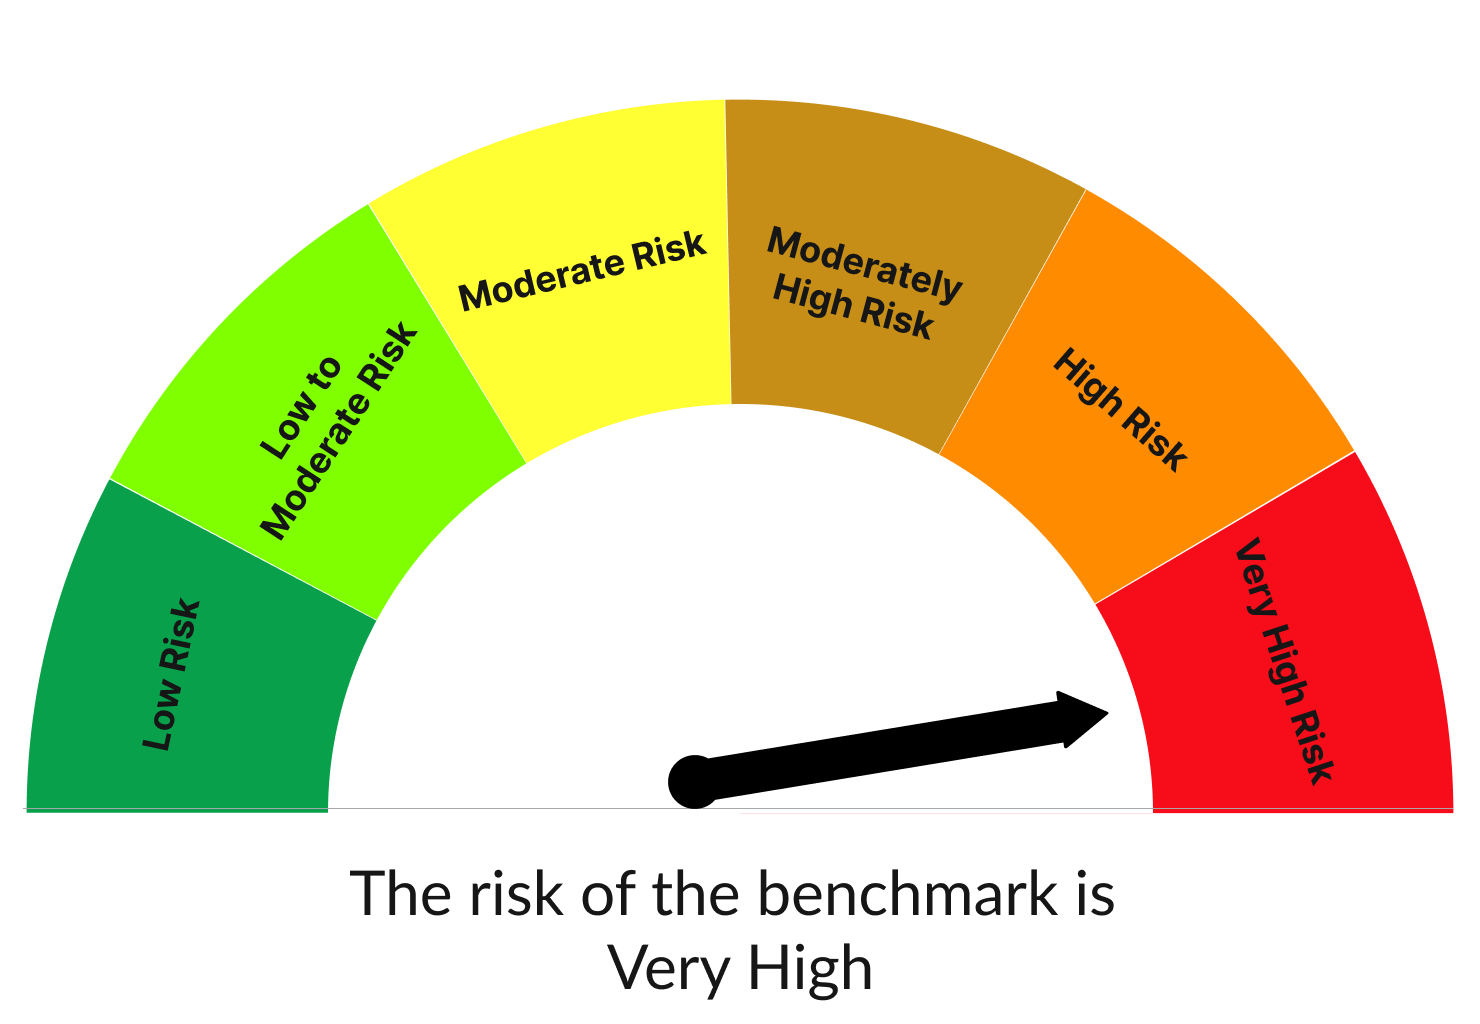
Very High RiskThis product is suitable for investors who are seeking *
Capital appreciation over long term
Investing in equity and equity related securities of companies following the Consumption and Financial Theme
Riskometer

* Investors should consult their financial advisers if in doubt above whether the product is suitable for them.
-
AUM(in Cr)
` 1695As of Mar 31, 2025 -
Age
12 years 4 monthssince 02-Jan-2013 -
Horizon
-
Goal
-
Benchmark and it's Risk-O-Meter
BSE 100 TRIRiskometer
* Investors should consult their financial advisers if in doubt above whether the product is suitable for them.
Performance
- Annualized Returns
- Absolute Returns
This Scheme
18.89
- Different plans shall have different expense structure. In case of return calculated the IDCW(dividend) option, it is assumed that IDCW(dividend) declared under the schemes have been reinvested at the prevailing NAV
- Past performance may or may not be sustained in future and same may not necessarily provide the basis for comparison with other investment
- Load is not considered for computation of returns
- Period for which scheme’s performance has been provided is computed basis last day of the month-end preceding the date of advertisement. In case, the start/end date of the concerned period is a non-business day, the NAV of the previous date is considered for computation of returns
- The data of the last working day has been considered for the calculation of performance
- Wherever TRI data since inception for benchmarks is not available, benchmark performance is calculated using composite of CAGR and TRI values of the benchmark
- The performance of the schemes is benchmarked to the Total Return variant of the Index
- For lumpsum investments, if the investment period is less than 1 year then same return values are displayed for absolute & XIRR. For periods above 1 year, they are annualized. 1 Year is assumed as 365 days.
- Returns for investments in dividend plans of schemes are calculated after assuming that the net dividend payouts post statutory taxes & levies, are re-invested back in the scheme.
- Dividends declared from benchmark's constituents isn't taken into account when comparing with investment in scheme's dividend plans.
- Performance is always compared against the latest benchmark of the scheme irrespective of the date of change of scheme's benchmark, if any.
- Except when SIP tenure is since inception, for all tenures, the start day for SIP investments is considered as 1st of every month. There is no end date to SIPs for the purpose of graphs.
- For the purpose of NAV date applicability, if the investment date happens to be a non-business day, next business day's NAV is applied. Investment on inception date can happen on a non-business day.
Fund Managers
-
Ennette Fernandes
-
Shridatta Bhandwaldar
Investment Objective
Scheme Documents
Historical Returns
Comparative performance of as of Apr 30 , 2025
- Dividend History
- As per SEBI
DIVIDEND DISTRIBUTED
- For lumpsum investments, if the investment period is less than 1 year then same return values are displayed for absolute & XIRR. For periods above 1 year, they are annualized. 1 Year is assumed as 365 days.
- Returns for investments in dividend plans of schemes are calculated after assuming that the net dividend payouts post statutory taxes & levies, are re-invested back in the scheme.
- Dividends declared from benchmark's constituents isn't taken into account when comparing with investment in scheme's dividend plans.
- Performance is always compared against the latest benchmark of the scheme irrespective of the date of change of scheme's benchmark, if any.
- Except when SIP tenure is since inception, for all tenures, the start day for SIP investments is considered as 1st of every month. There is no end date to SIPs for the purpose of graphs.
- For the purpose of NAV date applicability, if the investment date happens to be a non-business day, next business day's NAV is applied. Investment on inception date can happen on a non-business day.
| CAGR since Inception | |||
| 1 Year | |||
| 3 Year | |||
| 5 Year | |||
| Current Value of 10,000 invested at inception | ` 0 | ` 0 | ` 0 |
Why you should invest
Other information
-
Minimum Investment
-
Entry Load: Nil
-
Exit Load
Prescribed Asset Allocation
-
Equity and equity related instruments of companies which directly or indirectly benefit from the growing consumer demand in India - 80% to 100%. (Risk- High)
-
Other Equity and equity related instruments - 0% to 20%. (Risk- High)
-
Debt and Money Market instruments - 0% to 20%. (Risk- Medium to Low)
-
Reits/Invits- 0% to 10% (Risk-medium to High)
Current Asset Allocation*
-
Equities95.20%
-
Debt Instruments0.00%
-
Government Bonds0.00%
-
Money Market0.00%
-
Others4.80%
Asset Allocation as on Mar 31, 2025
Portfolio Statistic
-
Portfolio Turnover Ratio0.23
-
Standard Deviation13.54 %
-
Portfolio Beta 0.92 %
-
R-Squared0.79 %
-
Sharpe Ratio 0.68 %
-
Expense ratio
-
Regular Plan2.10 %
-
Direct Plan0.85 %
PortfolioMar 31, 2025
Market Capitalization
Sector Allocation
Top 10 Holdings % of TotalMar 31, 2025
Note – Scheme may or may not have any future position in the above Sectors(s) / Stock(s) / Issuer(s)
Credit Rating Profile
Instrument Break-up
Top 10 instruments by holding % of Total Mar 31, 2025
|
This product is suitable for investors who are seeking* |
||
|---|---|---|
|
Risk-o-meter
|
Benchmark Risk-o-meter
|
View Similar Funds
NAV As on 07-May-2025
61.180.22 (0.36%)CAGRSince Inception
13.09%Very High Risk
This product is suitable for investors who are seeking *
Capital appreciation over long term
Investing predominantly in equities and equity related instruments of large cap companies
Riskometer
* Investors should consult their financial advisers if in doubt above whether the product is suitable for them.
NAV As on 07-May-2025
167.161.34 (0.81%)CAGRSince Inception
18.90%Very High Risk
This product is suitable for investors who are seeking *
Capital appreciation over long term
Investment in equity and equity related securities with a statutory lock in of 3 years and tax benefit
Riskometer
* Investors should consult their financial advisers if in doubt above whether the product is suitable for them.
Canara RobecoREG - G
Emerging Equities
Large & Mid Cap Fund – Equity SchemeNIFTY Large Midcap 250 TRI
NAV As on 07-May-2025
242.672.76 (1.15%)CAGRSince Inception
17.13%Very High Risk
This product is suitable for investors who are seeking *
Capital appreciation over long term
Investing predominantly in equities and equity related instruments of both large cap and mid cap companies
Riskometer
* Investors should consult their financial advisers if in doubt above whether the product is suitable for them.
NAV As on 07-May-2025
321.531.98 (0.62%)CAGRSince Inception
17.38%Very High Risk
This product is suitable for investors who are seeking *
Capital appreciation over long term
Investment in equity and equity related instruments across large cap, mid cap, small cap stocks
Riskometer
* Investors should consult their financial advisers if in doubt above whether the product is suitable for them.
NAV As on 07-May-2025
18.770.10 (0.54%)CAGRSince Inception
17.16%Very High Risk
This product is suitable for investors who are seeking *
Capital appreciation over long term
Investment in equity and equity related securities across market capitalisation in maximum 30 stocks.
Riskometer
* Investors should consult their financial advisers if in doubt above whether the product is suitable for them.
Canara RobecoREG - G
Infrastructure
Thematic - Infrastructure – Equity SchemeBSE India Infrastructure TRI
NAV As on 07-May-2025
147.381.15 (0.79%)CAGRSince Inception
14.84%Very High Risk
This product is suitable for investors who are seeking *
Capital appreciation over long term
Investing in equities and equity related instruments of companies following the Infrastructure Theme
Riskometer
* Investors should consult their financial advisers if in doubt above whether the product is suitable for them.
Canara RobecoREG - G
Manufacturing Fund
Manufacturing Fund – Equity SchemeNifty India Manufacturing TRI
NAV As on 07-May-2025
11.250.10 (0.90%)CAGRSince Inception
NAVery High Risk
This product is suitable for investors who are seeking *
Long term capital appreciation
Investments in equity and equity related instruments of companies engaged in the manufacturing theme
Riskometer
* Investors should consult their financial advisers if in doubt above whether the product is suitable for them.
NAV As on 07-May-2025
15.340.19 (1.25%)CAGRSince Inception
19.25%Very High Risk
This product is suitable for investors who are seeking *
Long term capital appreciation
Investments predominantly in equity and equity related instruments of mid cap companies.
Riskometer
* Investors should consult their financial advisers if in doubt above whether the product is suitable for them.
NAV As on 07-May-2025
13.490.16 (1.20%)CAGRSince Inception
18.34%Very High Risk
This product is suitable for investors who are seeking *
Long term capital appreciation
Investment in equity and equity related instruments across large cap, mid cap, small cap stocks
Riskometer
* Investors should consult their financial advisers if in doubt above whether the product is suitable for them.
NAV As on 07-May-2025
35.40.36 (1.03%)CAGRSince Inception
22.51%Very High Risk
This product is suitable for investors who are seeking *
Capital appreciation over long term
Investing predominantly in equities and equity related instruments of small cap companies
Riskometer
* Investors should consult their financial advisers if in doubt above whether the product is suitable for them.
NAV As on 07-May-2025
17.430.11 (0.64%)CAGRSince Inception
16.31%Very High Risk
This product is suitable for investors who are seeking *
Long term capital growth.
Investment in equity and equity related instruments by following value investing strategy.
Riskometer
* Investors should consult their financial advisers if in doubt above whether the product is suitable for them.